Suitability per roof surface
Tilt, orientation and shading from neighbouring buildings and trees give each surface a suitability class.
Which roof is worth solar panels? Here is the official solar cadastre (Solarkataster) of every German state, checked on 18 November 2026. EstateManager also shows the solar potential on every property, for any address in Europe.
No credit card. The trial ends by itself.
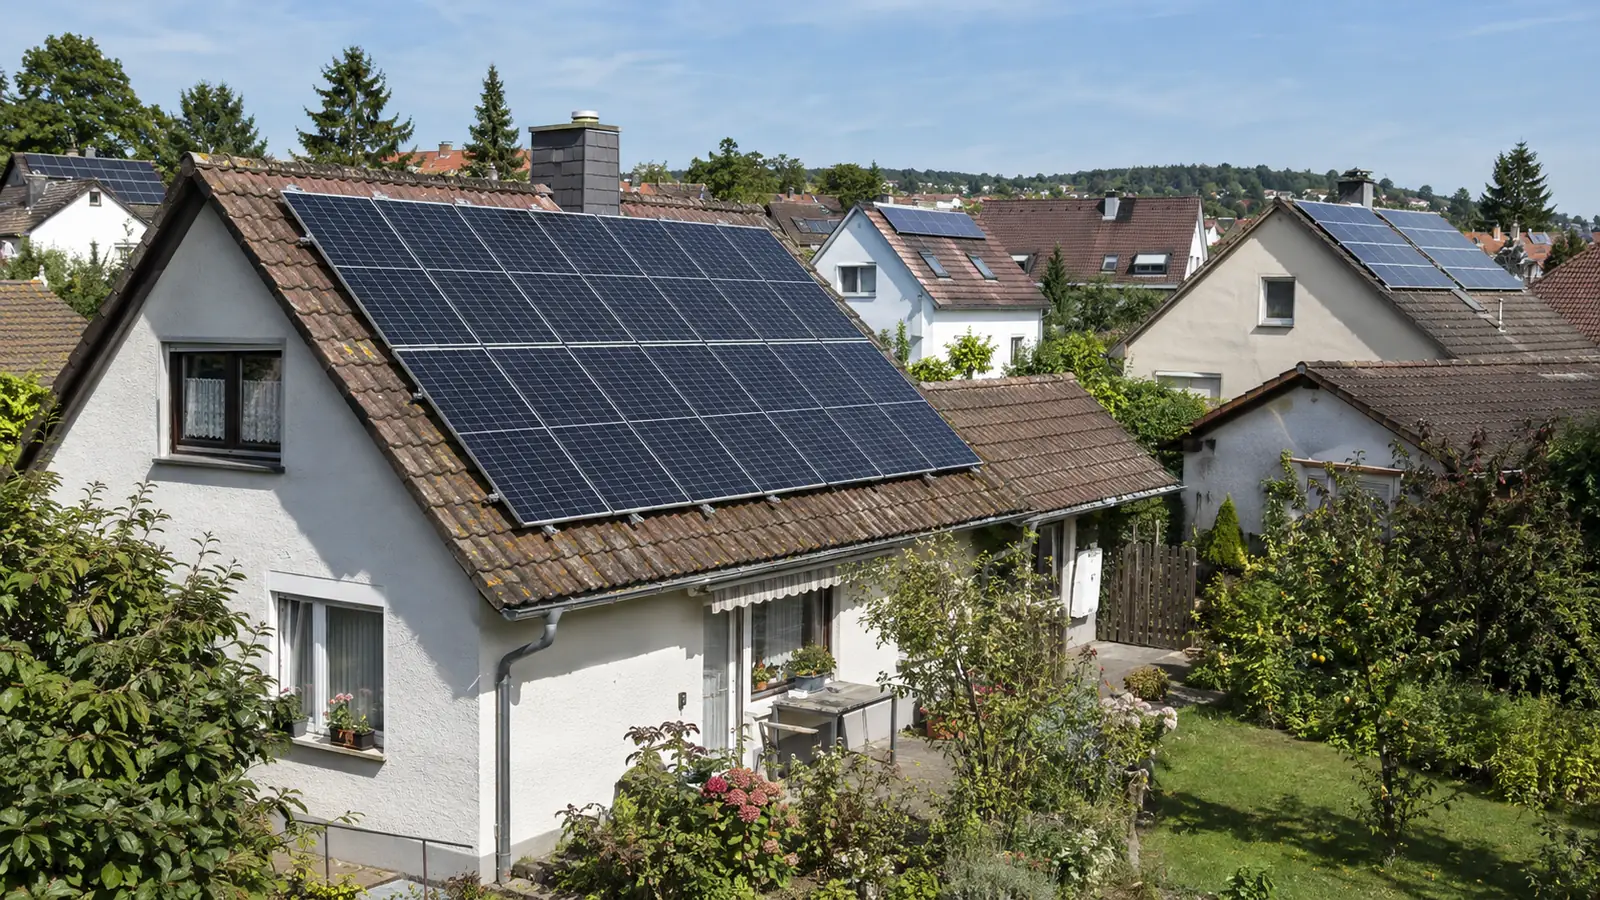
Enter the address in your state’s solar cadastre or click the building on the map.
The map colours every roof surface by suitability, usually with possible panel area, output and annual yield.
Many cadastres also estimate economics and self-consumption. For a quote, an on-site check decides.
The cadastre shows one roof. EstateManager shows the solar potential on every property in your portfolio, also in states without a cadastre.
Yield in kWh per kWp, optimal tilt and orientation, from the European Commission’s PVGIS.
The same analysis for any address in the EU, not only in some German states.
Sun path, wind, noise, flood and price trend in the same place.
All properties with their location data on the map and as a workbook.
State cadastres use laser-scan data from the land survey to calculate how much sun reaches each roof surface.
Tilt, orientation and shading from neighbouring buildings and trees give each surface a suitability class.
Most cadastres show electricity from PV, many also heat from solar thermal, some open-space areas and green roofs.
Built-in calculators estimate system size, costs, self-consumption and payback. The assumptions can usually be adjusted.
All links opened and checked on 18 November 2026.
| State | Solar cadastre | Operator | Coverage |
|---|---|---|---|
| Baden-Württemberg | Solardachkataster, Energieatlas BW | LUBW | statewide, per building |
| Bavaria | Energie-Atlas Bayern: PV on roofs | Bavarian Ministry of Economic Affairs, LfU | statewide, per municipality |
| Berlin | Energieatlas Berlin, solar potential | Berlin Senate Department | citywide, per building |
| Brandenburg | Solaratlas Brandenburg | Brandenburg Energy and Climate Agency | statewide, roofs and open space |
| Bremen | Solarkataster Bremen | Free Hanseatic City of Bremen | per building |
| Hamburg | Hamburger Solaratlas | Hamburg Environment Authority | part of the city |
| Hesse | Solar-Kataster Hessen | LEA Hessen state energy agency | statewide, roofs and open space |
| Mecklenburg-Western Pomerania | EstateManager shows the solar potential from PVGIS for every address | — | no statewide cadastre |
| Lower Saxony | Solardachkataster Südniedersachsen | Energy Agency Göttingen Region | regional: Göttingen and Northeim districts |
| North Rhine-Westphalia | Solarkataster NRW | LANUK NRW | statewide, with solar calculator |
| Rhineland-Palatinate | Solar- und Gründachkataster | Rhineland-Palatinate Energy Agency | statewide, per building |
| Saarland | Solarkataster Regionalverband Saarbrücken | Regionalverband Saarbrücken | regional |
| Saxony | Solarkataster Sachsen | Saxon Energy Agency SAENA | statewide, with yield calculator |
| Saxony-Anhalt | EstateManager shows the solar potential from PVGIS for every address | — | no statewide cadastre |
| Schleswig-Holstein | Solarkataster | Stadtwerke Kiel | per building |
| Thuringia | Thüringer Solarrechner | ThEGA, Thuringian Energy Agency | statewide, roofs and open space |
Operator and coverage as stated on the cadastres’ own pages. Links open the official service in a new window.
What each state cadastre shows and who runs it. All details as stated by the operators, checked on 18 November 2026.
The Solarkataster in the Energieatlas NRW of the state agency LANUK covers all of North Rhine-Westphalia. It shows PV and solar thermal for every roof surface, plus search areas for open-space systems. A solar calculator estimates yield and economics.
Open Solarkataster NRWThe Solar-Kataster Hessen of the state energy agency LEA covers all of Hesse. It rates roofs and open-space areas for PV and solar thermal.
Open Solar-Kataster HessenThe Rhineland-Palatinate Energy Agency runs a solar and green-roof cadastre in its Energieatlas for the whole state. It shows PV and solar thermal per building and which roofs suit greening.
Open Solarkataster RLPThe Energie-Atlas Bayern shows roof PV potential per administrative region, district and municipality, not per building, plus maps for open-space PV, global irradiation and a solar area exchange.
Open Energie-Atlas BayernThe Solardachkataster of the state agency LUBW in the Energieatlas BW covers the whole state. It rates every roof surface for PV and works via address search.
Open Solardachkataster BWThe Solarkataster Sachsen of the Saxon Energy Agency SAENA covers the entire state. It shows PV suitability per roof and includes a yield calculator.
Open Solarkataster SachsenThe Energieatlas Berlin of the Senate Department shows the solar potential of every building for PV and solar thermal under “Solarenergie”.
Open Energieatlas BerlinThe Brandenburg Energy and Climate Agency runs the Solaratlas for the whole state, showing roofs and open-space areas for PV with an economics calculator.
Open Solaratlas BrandenburgThe Thüringer Solarrechner of the energy agency ThEGA, commissioned by the environment ministry, shows roofs and open-space areas for PV based on state survey data.
Open Thüringer SolarrechnerThe Solarkataster of the Free Hanseatic City of Bremen shows the PV suitability of every roof and calculates the economics.
Open Solarkataster BremenThe Hamburger Solaratlas of the environment authority shows which roofs suit PV and solar thermal. It covers part of the city.
Open Solaratlas HamburgAt solarkataster-sh.de, Stadtwerke Kiel offer a solar cadastre with PV suitability and economics per roof. The state itself does not run one.
Open SolarkatasterLower Saxony has no statewide solar cadastre. For the districts of Göttingen and Northeim there is the Solardachkataster Südniedersachsen of the Göttingen region energy agency, plus cadastres of individual cities and regions.
Open Solardachkataster SüdniedersachsenSaarland has no statewide solar cadastre. The Regionalverband Saarbrücken runs one for its area.
Open Regionalverband cadastreMecklenburg-Western Pomerania has no statewide solar cadastre. EstateManager shows the solar potential of any address from the European Commission’s PVGIS.
Saxony-Anhalt has no statewide solar cadastre either. EstateManager shows the solar potential of any address from the European Commission’s PVGIS.
With the solar potential on the property you answer the question about power from the roof with figures and a source.
Yield per kWp, optimal orientation and tilt as a sourced figure, not a promise.
A well-oriented roof is an argument for buyers. A shaded roof is explained before anyone discovers it.
The same analysis for a holiday home in Spain or an apartment in Austria, because PVGIS covers all of Europe.
Sun path, noise, flood and price trend on the same property.
A map showing how suitable each roof surface is for photovoltaics or solar thermal. It is based on laser-scan data from the land survey, from which tilt, orientation and shading are calculated.
In the Energieatlas NRW of the state agency LANUK. Search the address, see the suitability of every roof surface and calculate the yield with the solar calculator. The link is in the table above.
Yes, the Solar-Kataster Hessen of the state energy agency LEA. It covers all of Hesse and shows roofs and open-space areas for PV and solar thermal.
As of 18 November 2026 Lower Saxony, Mecklenburg-Western Pomerania, Saxony-Anhalt and Saarland. Lower Saxony and Saarland have regional cadastres, some cities their own. Bavaria shows roof potential per municipality only.
Good for a first estimate. Skylights, dormers, roof condition and structure are not in the data. Before a quote, an installer checks the roof on site.
EstateManager calculates yield, optimal tilt and orientation for any address in Europe from PVGIS, the European Commission’s solar calculator, directly on the property.
Upload the brochure. EstateManager creates the property and shows solar yield, sun path and all location data at the site.
Try 14 days free